It's a Team's Life
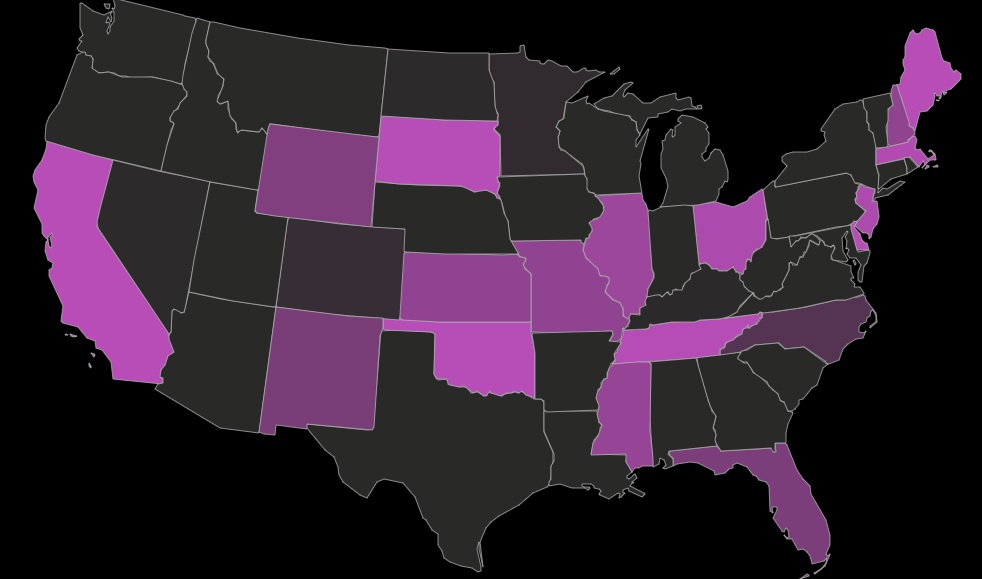
Nextbase Dash Cams Interactive Crash Map
Ever wonder while you are driving down a road if you are in a deadly crash area or not? Now someone has made it easy to find that out with an interactive crash map that complies the crash data from the National Highway Traffic Safety Administration (NHTSA). The latest data available is from 2021.
You and find the map here: Nextbase Interactive Crash Map
The map breaks the fatal crash numbers down to state, county and city level. If you click on a particular state, it will show you the top 5 counties in that state that has the highest number of fatal crashes. Just a side note this is all based on fatal “car” crashes. When you first start the map, the states will start flashing. This represents every fatal crash in that state per hour. It is amazing to watch the map for a short time and you really get a feel for which states have the most fatal crashes.
Let’s look at a few examples that you can get from this map. Remember these are numbers from 2021.
1. Texas is the state with the highest number for fatal crashes at 4,068. That is 79 a week and 12 per day.
2. The city with the most was Houston, TX with 324 for the year.
3. The state we could find with the least was Rhode Island with 61 for the year.
If you click on a certain state, you can view the stats for it per year, month, week and day. Then you can break it down to the 3 worst months. They also give you the 5 worst counties and cities in that state.
So, when you get a chance check it out and see if where you have been driving has the most fatal crashes.
Sandy & Stephen
We’re Burning Daylight - “Wil Anderson” (The Cowboys) John Wayne