Dollars & Sense
Introducing Supply-Demand Index, Sylectus-style
Earlier this week, expedited software technology and analysis firm Sylectus released a report looking at the supply and demand sides of the trucking industry. In a word, it's very interesting.
This report represents a significant change in their typical "Load Index" report, which tracked available loads in North America. They've recently added fleet count to the load index, which, according to Sylectus, reasonably represents a supply and demand report for the trucking industry in North America, according to the data they're able to collect.
Here's the chart, as they've constructed it:
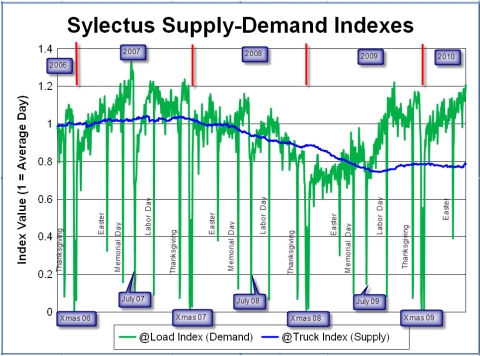
As you can see, the chart goes back quite a way, to Thanksgiving 2006, all the way through April of this year and is fairly self-explanatory: supply follows demand by a couple months or so and, when demand drops off significantly, as happened in 2008, you see an eventual decrease in supply. The interesting thing that occurs on the chart here is that while demand has returned, supply has seemed to stay well below what would be typical. Sylectus states that this means "Some trucking companies are now starting to get better rates for their fleet. It is harder to add capacity to a fleet than it is to reduce capacity." They also note that many of the carriers use Sylectus's "Alliance fleet availability" and are "Utilizing their existing fleet better. For example, instead of sending one of their trucks out of their core area, they find an Alliance aprtner that needs to reposition a truck and broker the load to that partner. The result is that they keep their trucks in their core area and Alliance partners handle the non-core work."
This means that the relative "Supply" to which Sylectus refers may just stay lower than it has because carriers are finding ways to handle demand with the trucks they have available. Keep in mind, of course, that the chart refers to Sylectus partners--and while one is able to make clear statements about the industry in general based on these numbers, there may be some uncalculated standard deviation one can derive from this fact. That said, the reduction on the supply side denotes a clear inference that a number of carriers (and drivers, for that matter) exited business when the economy crashed and the subsequent "leveling out" of the supply side represents the remaining carriers handling the rises and falls in demand, which represents some measure of growth--and potential future growth--for these businesses.